Monday, April 20, 2020

Lab 10 SSoT Measured Ground Control

Figure 1: Mission Plan Using the Measure Ground Control App. 

Introduction:

In this lab we introduced the concept of single source of technology (SSoT) and how it relates to safety and efficiency.  To explore this we are using the Measure Ground Control app, which is an app specifically for UAS operations. The measured ground control app is an example of SSoT as it allows us to plan missions, control aircraft and sensors, and record and store data all in one place that is accessible to everyone involved in the mission. This makes crew resource management much easier and efficient for everyone involved. Additionally, the Measured Ground Control app also has several features that promote safe and controlled UAS operation such as access to LAANC (low altitude an notification capability) and the ability to create and save checklists for various UAS platforms and sensors; which I will go into more detail with below.

Overview:

Figure 2. App home screen 


Let's walk through the Measure Ground Control app. When you first open the app you are greeted with four options as seen above in figure 2; we'll walk through these one by one. Starting form left to right with the airspace map. This menu allows us to see airspace conditions and restrictions, access LAANC, and get a general overview of the airspace.
Figure 3. Airspace Map Screen 

Figure 4. Airspace Rules and advisories for figure 3
In figure 3 above, you can see the airspace map when it first opens; figure 3 is showing the area around an airport I previously worked at and you can see the amber colored circle denoting it's airspace. You can also see similarly colored areas highlighted on the airspace map which denote areas with airspace restrictions or advisories; by tapping the red triangle in the lower right hand corner of the screen you can bring up a detailed list of the airspace restrictions and advisories currently on the screen as seen in figure 4. Similarly in figure 4 you can see a few options on the left side of the rules and advisories tab as to operating rules. FAA part 107 certified comes as the recommended default which works great for my uses. On the right side of the same tab We see a break down of the various airspace rules in the area, by tapping on each of them you can bring up a detailed report of the specifics of each area.
Figure 5. Airspace Map around Purdue University  

Figure 6. Airspace breakdown around Purdue University
The Figures 5 & 6 above show another example of the airspace map around Purdue University as you can see this area has a more complex airspace. The Airspace map is easy to navigate by dragging your figure across the screen or alternatively, you can search for specific areas as seen in figures 7 & 8 below. 

Figure 7 Martell Forest  

Figure 8 Purdue Wildlife Area
The airspace map is also where we can access the LAANC system. This system is a great tool for UAS operators to use and become familiar with as it allows us to request permissions to operate a UAS mission in the airspace at the push of a button. 
Figure 9. LAANC Authorization feature 
As seen above I wasn't exaggerating when I said push of a button. However, there is one stipulation to using the LAANC system in the Measure Ground Control app which is that you must download and have open the AirMap app. Which is a a little odd but doesn't make this function any less valuable. 

Moving on to the settings tab, this allows us to configure the various componets of our operation such as sensor settings, aircraft settings, data storage etc. Its a fairly standard affair as far as settings go and Measured Ground Control has a comprehensive help page that explains indetail the various settings and options linked here: https://www.measure.com/help/mobile-flight-app

Figure 10. Settings tab
As seen in the figure above the settings tab also has a side tab for creating checklists for missions. This is a great tool to use as it allows operators to ensure that the critical systems and sensors for their operation are properly prepared and maintained. 

Moving to the flight tab. The flight tab is used for controlling a UAV in manual flight and works similarly to most other mobile based platforms. One notable feature of the flight tab is that it allows you to access the sensor settings and flight control options at the same time, Thus allowing for a single operator to manage both the platform and sensors from a single screen.

Figure 11. Manual Flight Tab
Note: No UAV was connected to the system in figure 11 thus the screen is black. 

Finally the flight plan screen allows the user to create, save, and share flight plans by a intuitive interface that is easy to use. 
Figure 12. Overview of flight planing tab  

Figure 13. Flight planning options 

Figure 14. Flight times comparison
In figure 12 you can see a general overview of the floght planing tab. In that example I chose to draw a plan over the airport I used to work at. The interface is easy to use with various options to choose from when selecting a platform and sensor as well as various flight layouts. In figure 13 &14 notice the difference between flight times and altitudes. 

If there is one technical issue I found while testing this app it's that the terrain following option in the flight plan tab tended to crash the app.

Conclusions:

Mission planning is imperative to the success and safety of UAS operations in order to ensure that crew, platform, and sensor resources are used effectively. And that flights are done in a safe and legal manner. Record keeping is general good practice for any business and equipment maintenance is imperative to keep any operation running. The SSoT approach that the measured ground control app enables for UAS operators allows all the above aspects to be managed all in one place and is a great tool for efficiently and safely operating a UAS mission. 

Sunday, April 19, 2020

Lab 7 Volumetric Analysis with UAS

Figure 1: Volumetric Analysis
Introduction:

In this lab we used Pic4D & ArcPro to preform a volumetric analysis on the Wolfcreek area. A volumetric analysis in ArcPro is using image data and data sets from Pix4D to calculate the volume of a specified area; an example of which you can see above in figure one. There are several tools within ArcPro that help facilitate this an there are many different methods to use depending on what the application is; many of these we will go into detail with below. However before we do that we need to understand what we need in order to do a volumetric analysis. Obviously we need image data of the target area which we can get from Pix4D, we also need accurate GCP data of the area in order to ensure our location and altitude data are accurate.

Methods:


Figure 2: Pix4D Processed Volumetric Data

To start off the process, we need to process our image data in Pix4D. This is done the same way as we are familiar with from before. After moving our raw data into the project we first defined our area of interest usinh the clip function, in this example the stockpiles in the north end of the image data as seen in figure 3 & 4 below.
Figure 3: Stockpiles Clip
Figure 4: Stockpiles Location
With this done we can start processing the volume data, it's important during this time to make sure to resample our data as needed in order to get accurate results. After this is done we can use thwe various means of calculating volume to create a table of values, the results of which are below. We use different ways of calculating volume in this case to explore the options we have as they will all give different results.
Figure 5: Volume Calculations by Align with Lowest Point
Figure 6: Volume Calculations by Align with Highest Point
Figure 7: Volume Calculations by Custom Altitude (293")
Figure 8 Volume Calculations Align by Average Altitude
Figure 9: Volume Calculations by Fit Plane
As you can see we have a few different options to choose from when determining the volume of the area.
With this data in hand we can move on to ArcPro to create a usable map. After creating our database we'll use the polygon tool to mark our area of interest. Then we can use the extract by mask tool to clip out the aggregate piles we did our volumetric work on in Pix4D. We can then use the surface volume tool on the raster files to do just that and fin the surface volume.

Discussion:

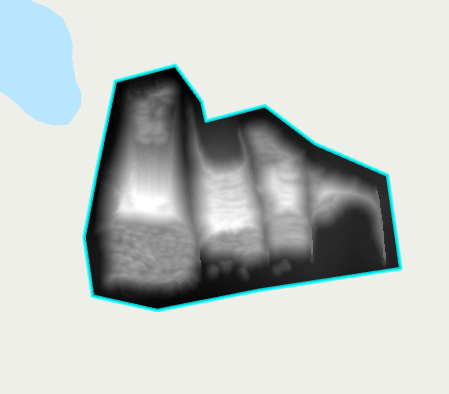
We've already seen the end result of the Pix4D volumetric analysis in figure 2 but I want to draw attention to the table of values below, this tables compiles the values found in figures 5-9.
Table 1: Values of Different Volumetric Tools

Note the differences in total volume between the various methods, particularly the custom altitude method and the lowest point method; they are very similar to each other and much larger then the other methods; this is important as we can use our GCP data to verify the altitude of the land around the clip and establish that as the "bottom" of the stockpile.

Moving on to the ArcPro side of things we see one of the primary uses of Volumetric analysis as it pertains to us, that being the change in volume or area over time. In the figures below we examine the change in volume of an aggregate pile over a period of time.
Figure 10: Lithcfield Volume Over Time

Figure 11: Litchfield Change in Volume
This kind of data has a multitude of uses from a business perspective such as keeping track of stock and waste, or future development. But beyond this particular type of business being able to calculate the volume or change in volume of an area with UAS has many possible applications; such as, tracking the progress of erosion, deforestation, or change in waterways. These are just some of the possibilities I could name offhand.

I also want to take a quick aside to reaffirm the importance of resampling and ground control. I've discussed this at length in previous entries but now we can visually see the purpose of such. GCPs are needed to gain the level of accuracy in position data needed for applications like this; as seen in the figures and tables above when dealing with large areas being off on position by even a few feet can dramatically change your results. Resampling is important much for the same reasons as it allows to make the DSM data more accurate. 

Conclusion:

In conclusion, volumetrics are vastly helped by the use of UAS as they allow for detailed information to be gathered over a long time with greater efficiency than other platforms. However accurate data and proper usage of the resources available in GIS are key to making the most of its uses. And as I alluded to before the number of uses for this are limited mostly by imagination.


Tuesday, March 3, 2020

Lab 6: Processing Pix4D imagery with GCPs

Figure 1: Orthomosaic Map with GCP Data and Positions
Introduction:

In this lab we took a more in dept look at ground control points (GCPs). As we discussed in a few previous labs, GCPs are used to correct image data for increased location and elevation accuracy. The main way they accomplish this is by providing a fixed point of reference with know position data that image processing software like Pix4D can use to correct image data. The way it works is similar to a GPS systems use of "checkpoints"; GCPs are basically the same thing except were checkpoints can only provide fixed position data, GCPs are used to correct image data using the position data they provide. You can see what GCPs are and the data they provide in the figure above.

Methods:

For the lab we were given a data set that contained GCP data and used Pix4D to process the data and generate point cloud and pyramid data like we discussed in a previous lab.  In figure 2 below you can see the initial quality report generated by Pix4D after initial processing. Note that it contains the GCP data but it gives a red indication beside it, This tells us that the reference data given by the GCPs and the position data found when Pix4D processed the image data do not match within tolerance and must be corrected.
Figure 2: Initial Quality Report showing GCP Data
In order to correct the discrepancy between the fixed position data given by the GCPs an the image data generated by Pix4D we use the GCP tools in Pix4D to align the data in the orthomosaic map generated by Pix4D with the GCP markers in the image. Sense Pix4D knows the exact location where the GCPs are  once we point out where the GCPs are on the Image data, Pix4D can correct the image data to be more accurate and precise while also giving better image quality.
Figure 3: GCP Location shown in Ray CLoud.
In the Figure above you can see the process used to correct the GCP information. Note the blue circles that appear on the surface of the point cloud. These are the locations of the GCPs and the windowed view on the right hand side of the screen shows the area where Pix4D believes that image data to belong. Note that in this figure they do not match; the process of correcting the GCPs involves finding the GCPs on the map and making the image match. This can be a very time consuming process, but in this example we only have to locate 6 GCPs. 

Discussion:

Figure 4: Map Showing GCP Corrections 

Figure 5: Orthomosaic without GCP Corrections 
Comparing the two figures above, you can see that the overall image quality of the map with GCP corrections is better than the one without. This is due mostly because with the GCP corrections, the program doesnt have to make as many approximations when generating the point cloud and pyramid data, this results in a clearer, sharper image. But, perhaps more importantly for professional applications, the data is now more representative of the real world location in terms of position, elevation, and location. 

Conclusions:

GCPs are an essential part of creating accurate image data using GIS. While genrating clearer images is good for aesthetics, the real value in this is gaining more a more accurate representation of the real area being represented. As data without GCPs may be off by several hundred feet or more. 


Tuesday, February 25, 2020

Lab 5: Getting started with Living Atlas

Introduction:

In this weeks lab we began to explore the uses of the ArcPro virtual atlas. The living atlas is an online network of information, created by other ArcGis users that can be accessed and used by everyone using ArcGis. This is a great tool for us to use as we can import all sorts of information into out own projects; saving time by using preexisting information. As part of this lab we completed an online tutorial of useing the living atlas, this was a pre-made lesson from ESRI titled Get started with ArcGIS Living Atlas of the World. I'll also talk about some of the lessons that interested me in the living atlas, and finally show you a sample map I created using data from the living atlas. 

Method: ESRI: "Getting Started with ArcGIS Living Atlas of the World"

For this tutorial we started by learning how to search the living atlas and filter the results. You can see the deatils below in figures 1 & 2. 
Figure 1: Search & Filter Options

Figure 2: Filters used.
We were looking for a dataset called GLADAS Soil Moisture 2000. So that we can use it for the tutorial. After finding the dataset we can click on the thumbnail to learn about the project, view its metadata and get an overview of the map. After we opened the map we could use the ata tofind specific types of data within the set. The tutorial had us focus on the Eastern part of the Nile river and clicking on the map brought up information on the areas water content; You can see this in figure 3 below. 
Figure 3: Easter Nile Region Soil Moisture

The next major lesson in the tutorial was pulling data from the living atlas into our own ArcPro maps. To do this, the tutorial had us take a dataset of population density from 2004-2006. We started with a map of the contiguous 48 states of the US and then focus in on the cities of Las Vegas and Baltimore. Which you can see below in FIgures 4 & 5.  We learned how to change basemaps in the living atlas and how to specify data within a specified area from here. You can see what that looks like in figure 6. 
Figure 4: Las Vegas Population Density 2004-2005

Figure 5: D.C., Baltimore, and Philadelphia Population Map

Figure 6: Final Basemap and Symbology Changes. 
Notice that in figure 6 the basemap has changed and the are of focus has shrunk to better see the data. Additionally, the symbology was changed to make the map data clearer. 

For the final part of the tutorial we moved our experience over to our desktop version of ArcPro. We downloaded the Hurricane Irma Advisory 29 dataset from the living atlas through the catalog portal. We add the dataset by going to the catalog pane like we were going to add one of our own datasets and selecting the portal tab. From there we can select the living atlas tab and search for the Hurricane Irma datatset. We can see the dataset below in figure 7. 

Figure 7: Hurricane Irma Advisory 29 
 With this dataset we then could pull various statistics from the data and add more data to the map. The tutorial had us add a map of nuresing homes into the map in order for us to run a search query to figure out how many were affected by the hurricane. The results of which are show below in figure 8.

Figure 8: Hurricane Route and Affected Nursing Homes 
Note how the map becomes cluttered by the addition of the nursing home data. The search query within the area of affect of hurricane Irma allows us to easily gather numerical data on the nursing homes affected. With this our living atlas tutorial was complete and we started working on creating our own living atlas datasets. 

I created my map using living atlas data for landslide fatalities. I chose this because my homestate of Kentucky frequently experiences landslides due to the hilly terrain and abundant rainfall in the summer and fall. I wanted to see the correlation between where fatalities from landslides occur in relation to the availability of trauma centers, evacuation routes and landslide epicenters. The results of which you can see below in figure 9. 
Figure 9: Map of landslide Fatalities in Kentucky 
A quick side note: I attempted to remove the data aside from the basemap that was not the state of Kentucky as to reduce map clutter. I attempted to use a sql query but this did not work. I assume its because the basemap I used was included in the living atlas data and was not able to be separated. But I am by no means an expert.


Exploratory:

Once we learned the basic of the learning atlas we explored the lessons available in the learn.arcgis.com page. We were told to search the lessons and find 5 that personally interested us. 

The first lesson that caught my eye was Building a 3D Thematic Cityscape
This peaked my interest because It looked like a project that one of my friends and colleges here did about a year ago; creating a 3D map of our universities football stadium. If your intersed in seeing his work I highly suggest you check his blog about it in the hyperlink below:
The lesson goes into step by step detail on how to create a detailed 3D landscape using ArcGIS data. In the UAS world this is a great lesson to view as landscaping and mapping is a huge part of UAS data gathering.

The next lesson is the Fight Child Poverty with Demographic Analysis in ArcGIS Enterprise: https://learn.arcgis.com/en/projects/fight-child-poverty-with-demographic-analysis/arcgis-enterprise/
This caught my attention because I grew up in a very poor area and I was curious how GIS could help with improving conditions in impoverished areas. The lesson covers how to create map patterns and how to analyse the patterns in the map. Regardless of the personal connection to this particular lesson, I believe this was a great lesson as this offered great advice on how to interpret map patterns and what ArcGIS can do to analyse data. 

The third lesson was Overseeing Snowplows in Real Time: https://learn.arcgis.com/en/projects/oversee-snowplows-in-real-time/
This interested me because all of our labs so far have dealt with pre-compiled datasets and I was curious about how ArcGIS worked with data in real time. The lesson covered how to Create realtime web maps, apps and dashboards. It was an interesting lesson and not quite what I was expecting. 

The fourth lesson was Build a Model to Connect Mountain Lion Habitat: https://learn.arcgis.com/en/projects/build-a-model-to-connect-mountain-lion-habitat/
I picked this lesson because I think mountain lions are cool...
The lesson was another one about how to use ArcGIS to analyse and evaluate data. It went into more specific detail about specific tools to do this with. 

This was of inters to me because I wanted to know the difference between a 3D scene and a 3D map. The lesson covered how to create different affects on a 3D image or model with ArcGIS 

Conclusion:

ArcGIS's living atlas contains a wealth of data and information that can be used to build and support datasets or teach functions of the ArcGIS system. There is much to explore and dicover within the online help and lesson center and I encurege anyone working with the ArcGIS system to use it to their advantage. 

Tuesday, February 18, 2020

Lab 4 Processing Image Data in Pix4D

Introduction:
Figure 1: Demonstration of DSM with and without GCPs


 In this lab we took a bit of a step back and went through the data processing from the wolfcreek data we've been working on in the previous lab from the beginning. Our main goal of this lab was to compare the difference between data collected with and without  ground conrol point (GCP) corrections. We began by using Pix4D, an image processing software, to give us a 3D model of the terrain; after that we processed the data into a 3D map. Once the processing was done we were had a digital surface model (DSM) and an orthomosaic map.

Methods:

We began this lab by opening Pix4D and starting a new project. As always we organized our data with the same process we discussed in last weeks lab. We also named our new project in Pix4D by: ddmmyyy_location_aircraft/sensor_altitude_coordinate correction system. (coordinate correction system would be like ground control points). The next step is adding the images or folder path for the images we were going to use. Next we chose what coordinate correction system we would use for our data, but sense we were comparing our previous labs data with GCP correction we selected nothing for this step. Finally we could choose what to do with pour data; our ultimate goal was to get our DSM, but we also used Pix4D to generate an orthomosaic map and and a flyover animation of the map, which you can see below in figure 2.
Figure 2: Orthomosaic Animation
 Pix4D processes data in 3 broad steps: 1. initial processing 2. point cloud and mesh, and 3. DSM, orthomosaic and index. Initial processing is basically a quick check of the data to weed out any issues with the data and we would run this step of the process first in order to generate a quality report of the data. Once this initial processing was done (this time it took about 5mins) Pix4D generated a quality report that we checked for data errors and could to preview how our orthomosaic and DSM would turn out. Once we were satisfied with the quality of our data we could check the other 2 boxes for our processing. Pix4D can process all 3 of the aforementioned steps all at once but this is generally not a good idea as if there are problems with the data they can mess up your final product.

Step 2. is generating point cloud and mesh data. Point cloud is a set of data points that are on the surface of whatever image is being made. The animation in figure 2. above shows the point cloud and mesh data together. Note that it is a 3D image. After this, in step 3. the DSM and orthomosaic are processed and developed. These are raster files and are the same as the one we used last week in ArcPro. The key difference in this lab is that there are no GCP corrections. As a result the elevation values are very different.

Figure 3. Pix4D DSM without GCP corrections

Figure 4: Pix4D Orthomosaic image


Results & Discussions:

 Pix4D organizes it's data much like ow we organize ours. The three processing steps each have their own folder and organizes its data within those folders. For example the quality report will be in the initial folder, which contains another folder for reports. Within this report you can also find processing times for each of the 3 steps. You can see this table below in figure 5. In the point cloud folder we can wholes and deformations in the image data from a birds eye view. This is due mostly to the fact that the photos for this flight were taken from directly above thus, vertical entities such as the sides of buildings or very steep terrain can't be seen by the photo. This leaves a "whole" in the data and when you try to stitch the images together with meshing they look distorted.
Figure 5: Pix4D Processing times


Conclusion:

Pix4D is a great tool for processing image data. The initial processing step can save a lot of time and grief by checking image data quality and allowing for a preview of the processed data to be viewed. Pix4D also is what we predominately use to create our raster data such as the DSMs and orthomosaics. I Know of no other software that does this.

Friday, February 14, 2020

Lab 3 Creating Maps With UAS Data In ArcPro

Figure 1. Final Product


Introduction:

In this weeks lab we applied the basics we learned last week and were introduced to some new functions of ArcPro. We were now applying ArcPro to UAS data and the new functions we introduced were raster functions for the slope and aspect of a digital surface model as well as creating an orthographic image within the layout. An example of which you can see in figure 1 above.

Why are proper cartographic skills essential in working with UAS data?
Cartographic skills are an essential part of UAS operations for conveying the information you have in a concise and understandable format. Cartography is both the creation of maps and the science and theory behind them. As such, cartographic skills include the ability to know what additional data is needed to make a map and how to layout the data on the map in a way that makes sense to the viewer. As our professor said a good map is one that anyone could pick up off the street and know what they are looking at. This is important because it gives value to the information you gather with a UAS.

What are the fundamentals of turning either a drawing or an aerial image into a map?
To my knowledge, to turn an image into a map requires a sense of scale, location, and orientation. Additionally all of the maps we have worked with so far have had some kind of legend for the information they contained.

What can spacial patterns of data tell the reader about UAS data? 
Spacial patterns can be anything that gives meaning to data based on its relationship to its surroundings. An example of this would be elevation of an area where relatively low areas are shaded in cooler colors and relatively high areas shaded in warm colors.

What are the objectives of this lab?
The objectives of this lab were to learn what makes a good map and to create a map (or several maps) using UAS data in ArcPro. A good map for this lab meant including: a north arrow, scale bar, reference map, legend (when applicable), metadata, and a watermark. The north arrow gives a sense of direction and orientation, the scale bar a sense of scale of the area being viewed, the referance map shows where the area of interest is in the world, and the metadata shows how the data was collected and by who.

Methods:


Date Flown: June 13th, 2017
UAS Platform: M600 Pro
Sensor: Zenmuse X5
Altitude Flown: 70m
Ground Control GPS: Trimble UX5
Ground Control Coordinates: WGS84 UTM Zone 16
UAS Coordinates: WGS 84 DD
Pilot: Peter Menet
Example metadata used in lab

Once we got ArcPro up and running we began by making sure we were organizing our data appropriately as to avoid confusion and later. To do this, three folders were created in our computers main drive: 1 Collection. 2. Processing, and 3. Analysis. The collection folder contained any images, video, databases, and any other data we had to work with. The processing folder contained our ArcPro files, namely the GCP data. The Analysis folder contained our information as copies of the processing data as well as any images or projects we created in the lab, including the figures you see in this blog. Lastly we saved the project metadata in a text file outside of the folders for quick access

What key characteristics should go into folder and file naming conventions? 
Folder management and file naming conventions are all about organization and ease of access. We have three broad folders for the three main steps of working with GIS data (collection, processing, and analysis). This makes the data easy to retrieve and to work with. The collection folder serves as a place or all raw information to be gathered and sorted as well as to serve as a backup should data in the processing folder be lost or otherwise unsuitable. The processing folder is a work space where the data we are currently working on can be stored and accessed. Finally the analysis folder serves as a collection for finished products, supporting data, and other analytics. I personally make another sub-folder within this folder just for deliverable items for the class.

Why is file management  so key in working with UAS data? How does it relate to the metadata?
 File management is critically important because, especially with GIS data sets, you may be working with a very large amount of data over many days. As such its important to have a file management system that is consistent to allow for quick and easy access to information that everyone can follow. Especially in a professional context where you may have multiple individuals all working on the same project at different times or on different portions of the data consistency is vitally important to ensuring that everyone working on the project can find what their looking for.  This concept is mirrored within the metadata, where having a simple, concise and consistent data sheet is important.

What key forms of metadata should be associated with every UAS mission?
 All UAS metadata sets should include: date, time, and location of the flight.  The vehicle platform, sensor(s), and coordinate collection device used (i.e.gps). As well as the global coordinate system used.

Once our filing convention was set up, we put our data from the wolfcreek mining site from the previous week into the processing folder as this would be the data-set with GCP corrections we would use later. We added pyramids in order to make the image easier for the software to process and to make the images easier to interpret. Pyramids basically allow the software to generalize where pixels should be and without them the image would take a long time to load every time you viewed it or zoomed in and out on the image. Once the DSM data was added into the map we changed its symbology to RGB (red, green, blue) overlay as to better visualize the changes on elevation. We then used the aspect tool to identify the slope direction we were looking for. This raster function needed to have calculated statistics in order to run, thankfully ArcPro prompts you to do this when you use the aspect tool. These statistics, from my understanding, allow the program to interpret the colors projected on the map.

What basemap did you use? Why? 
For this lab we used a general street map as it shows the layout of the area with landmarks like roads and bodies of water for orientation

What is the purpose of the pyramid and calculated statistics commands? 
The purpose of the pyramid command is to make the data load faster and easier to view. The calculated statistics command is used by certain functions to gather specific data from map.

Why might knowing cell size, units, projection, highest elevation, lowest elevation be important? 
All of these values are important for interpreting the data correctly as without them the map may be misleading or difficult to interpret whats being shown

What is the differenc between a DSM and DEM?
DSM (Digital Surface Model) shows the "raw" elevation of the terrain; it will show entities like trees, buildings, and other objects on the surface as part of the viewed image. A DEM (Digital Elevation Model) will remove those entities and try to correct the elevation based on what data it has. T put it simply a DSM will look like an aerial photo with trees, buildings etc. while a DEM will look smooth and only show the terrain

What does hillshading do towards being able to visualize relief and topography?
Hillshading shows the difference in angle in reference to a norm (usually, level). Areas with a high degree of slop or angle will show as darker colors and flatter areas with low slops will appear in lighter colors.

How does an orthomosaic relate to what you see in the shaded relief of the DSM?
An orthomosaic image can help you visualize the change in terrain of a DSM by allowing you to see the area from multiple angles and give you better perspective on the changes in terrain.

What benefits does the hillshade and 3D view provide? How might this relate to presenting this information to a client or customer?
Hillshading offers benefits like showing the difference in elevation of the terrain, while a 3D image can give you better perspective.

What color ramp did you use? Why?
I used a yellow to red color ramp for my slope model with is opacity turned down to about 50%. I chose this because it was a contrasting patter that was different from the RGB scale on my hillshade and different enough from a traditional thermal color scheme that it wouldn't be confused.

How might generated slop and aspect forms of added data analysis prove useful value to various applied situations?
Generated slope and aspect can be used by those in the mining or stockyard businesses; as this information can help miners see and track the movement or erosion of the earth over time. While those with stockyards can use this to calculate how much a material or mound is present and how much they may sell or move over a period of time.

Figure 2. Aspect Map

Figure 3 Hillshaded DSM

Figure 4. Orthomosaic View

Figure 5. Slope Map


Conclusion:

Summarize what makes UAS data a Useful tool to the cartographer and GIS user
UAS data in conjunction with GIS is a very useful tool in cartography as it allows the user to cover a very large area quickly, and with a great deal of precision. It can also be used to access had to reach or dangerous places where traditional platforms may be unavailable or unsafe.

What limitations does the data have? What should the user know about the data when working with it?
The sensors and software aren't very useful for areas over large bodies of water or other reflective things as it can distort the image data. Airspace restrictions can also limit the scope of a UAS operation. Additionally, the processing of UAS data often requires a level of processing power not readily available to the average person and even if the infrastructure is in place to do such data processing it may take up to several days to fully process depending on the amount and type of data gathered. From the user side of things, one may be limited by their knowledge of the program in their ability to interpret the data; as ArcPro is a fairly expansive and nuanced program to use.

Speculate what other forms of data this data could be combined with to make it even more useful.
The data used in this lab could have been supplemented with a map of a water table or erosion map to better identify and track safety concerns to the operation. Additionally the same data we worked with in this lab could have been calculated over a longer period of time for a map of the change in the terrain over time. 

Tuesday, February 4, 2020

Lab 2 Getting started with ArcPro

Intro:

Today's lab was my first experience using ArcPro, or any GIS software, we completed a tutorial program in which we were using geospacial data to observe and predict the effects of road construction in the town of Rondonia, Brazil. In addition to learning the basics of using ArcPro this lab served to demonstrate fundamental GIS concepts, which I hope to pass on here.

1- What makes data geospacial? 
If I had to summarize it in one sentence; Geospacial data is data about things and events as it relates to specific points on the globe. I understand that may sound a little vague, but it really can be just about anything.

2- What makes data in a GIS different from a digital map? 
The key difference between GIS data and a digital map is that we can different "layers" of data to the map to establish relationships between objects and phenomenon with their surroundings. For example, if we want to understand how road construction will affect the ecosystem we can input layers of data for existing and planned roads, local flora, and the potential area for deforestation. (Foreshadowing much?)

3- Why is understanding geospacial concepts and geospacial data fundamental to working with UAS data? 
Just like how GIS data can have many layers of data, there are many "layers" to successful to UAS operations in a professional sense. Geospacial data can be a huge asset to UAS mission planning by allowing UAS operators to create databases containing all the relevant info they may need to plan a mission, i.e. terrain features, airspace restrictions, ground control points, crew placement, lines of sight, wildlife concentrations and much more. UAS can be and are a great method of gathering geospacial data due to their flexibility as a remote sensing platform.

4- What are some of the key geospacial concepts that this lab addresses?
Aside from the basic of using the software this lab addressed the concepts of databases, information sets, the use of correct projections and datum's.

Methods & Lab Assignment:

With that established, lets get started on what the lab actually entailed.

1- Finding what your looking for:
The first thing we had to do in the tutorial after opening the database provided was find the area we were interested in. We started with a topographical map of Brazil as our basemap an used the locate function to zoom in on the town of Rondonia. For this step its significant that the basemap was a topographical one as it helped to visualize where existing roads were in relation to their surroundings; and later on, making sure that the existing roads layer we added matched with their real world location.

2- Symbology and layers:
Once we added the first few layers we needed (existing roads, deforested areas, and protected areas) we started configuring their symbology and attributes to make the map clearer. Symbology in ArcPro allowed us to change various attributes of the layers such as, their color, names, transparency and their order of importance within the layer catalog. The symbology also allowed us to select layers by their attributes; meaning, we could select layers based on things like their relation to other layers.

3- The buffer tool:
With the basic map coming together we began adding in elements that would provide the data we were looking for, in this case the deforested area created by the road construction. We did this by using the buffer tool on a planned roads layer that created using attribute data from the unofficial roads layer we previously added. The buffer tool, much like its name implies, creates a shaded buffer region around a selected object or in this case a whole layer. We made the buffer extend 5.5km from  the planned road to predict the amount of deforested area that would result of this road were built.

4- Finishing touches:
With the planned road and the deforested area buffer added we had all the relevant information we needed for the project. However, to turn this from a basic image to a usable map we still needed to add some finishing touches. First of all, no map is a map without some sort of legend or key so we added a list of features and their symbology from the relevant layers of the dataset. Next we added an area map showing the relation of the working area compared to the rest of South America. And lastly a title. If i was going to make a change to this project I would also add a scale somewhere on the map for reference. The final product of the lab is show below.


Conclusions:

The ArcPro system is pretty intuitive as a GIS software, though that is speaking as a beginner with no experience on any other system so take that for what you will. But I was able to follow the tutorial pretty easily and only hit a few snags. What makes it stand out to me is the ability to have different layers of data interact with each other, such as when we digitized the purposed road over the planned road later and made it it's own thing. With all that being said the tutorial me nearly four hours to complete, it felt like drinking out of a fire hose. There are also a lot of nuances to how ArcPro works; for example, when you're trying to change the transparency of a layer you have to select the layer you want from the catalog pane not the one that's visible on the map. I also had some weird errors when it came to naming attributes that I still don't fully understand. Tying all this back to UAS, its clear to me the implications this type of information can have in UAS and how UAS can further improve upon GIS. Being as this proposed road would go through thick jungles which would not offer easy access UAS would be a valuable tool to use in the planned of proposed construction or in assessing the damage that deforestation would cause.


Evaluations

1. 1. Prior to this activity, how would you rank yourself in knowledge about the topic. (1-No Knowledge at all, 2-Very Little Knowledge, 3-Some knowledge, 4-A good amount of knowledge, 5-I knew all about this) 

2

2. 2. Following this activity, how would you rate the amount of knowledge you have on the topic (1- I don’t really know enough to talk about the topic, 2- I know enough to explain what I did, 3-I know enough to repeat what I did, 4-I know enough to teach someone else, 5- I am an expert)

2

3. 3. Did the hands-on approach to this activity add to how much you were able to learn (1-Strongly Disagree, 2-Disagree, 3-No real opinion, 4-Agree, 5-Strongly Agree)

4

What types of learning strategies would you recommend making the activity even better
I don't really know if I can offer a suggestion, this was my first experience with any software like this so I expected to be a little overwhelmed.